Activity 3: Exploring Concentration–Discharge (C – Q) Relationships
Introduction
Streams carry dissolved solutes that reflect the movement of water through soils, groundwater, vegetation, and human-altered landscapes. Hydrologists often study the relationship between stream solute concentrations (C) and discharge (Q), known as C–Q relationships, to understand how solutes are stored, mobilized, and transported within watersheds. By examining stream chemistry with respect to streamflow, scientists can infer where solutes originate, how long water remains in the subsurface, and the hydrologic pathways that connect landscapes to streams. Concentration-discharge relationships are quantified using the slope of a log(C)–log(Q) regression, which describes how strongly concentration changes as discharge changes (Figure 1). Stream discharge and concentration often span several orders of magnitude; log scales allow us to visualize both small and large values simultaneously and linearize power-law C-Q relationships. We use the slope of this relationship, b, to interpret the relationship between C and Q. In addition, the coefficient of determination (R2) describes how strongly concentration and discharge are related. Larger R2 values indicate that changes in discharge explain a greater proportion of the variation in concentration.
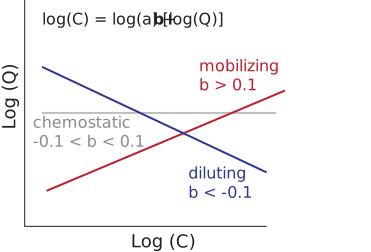
Figure 1: Conceptual model of C-Q relationships.
C–Q relationships are classified into three broad categories based on their slope: diluting, chemostatic, and mobilizing. A diluting relationship has a negative slope (b < -0.1), meaning concentrations decrease as discharge increases. This pattern occurs when streamflow during storms or snowmelt is dominated by dilute water sources, such as precipitation or snowmelt, reducing the concentration of the solute in the stream. A chemostatic relationship has a slope near zero (-0.1 < b < 0.1), meaning concentrations remain relatively constant across a wide range of streamflows. Chemostatic behavior suggests that solute sources are abundant and well mixed within the watershed, allowing streams to maintain similar concentrations even as flow changes. In contrast, a mobilizing relationship has a positive slope (b > 0.1), meaning concentrations increase with increasing discharge. Mobilizing behavior often indicates that storms or high flows activate additional solute sources from shallow subsurface or surface runoff pathways. Comparing both the sign and magnitude of C–Q slopes allows us to infer how strongly watershed transport processes respond to hydrologic events. Different solutes exhibit different C–Q behavior depending on their chemical properties and biological activity. Conservative tracers, such as chloride (Cl), tend to move through watersheds without being strongly altered by biological or chemical reactions, making them useful indicators of water flow paths and mixing processes. In contrast, non-conservative solutes, such as nitrate (NO3), are influenced by biological uptake, microbial processing, plant growth, and nutrient cycling. Environmental scientists and water quality managers use stream chemistry data to identify nutrient pollution sources, evaluate ecosystem health, and predict how watersheds respond to storms, drought, and land-use change. For example, nitrate transport is closely tied to agricultural runoff and can contribute to algal blooms and downstream water quality impairment, while chloride can indicate urban impacts such as road salt contamination. Comparing the C-Q behavior of conservative and non-conservative solutes helps scientists distinguish between hydrologic transport processes and biological controls on stream chemistry.
Learning Objectives
Analyze concentration–discharge (C–Q) relationships to infer patterns of solute storage and transport across diverse hydrologic settings.
Compare C–Q behavior across conservative and non-conservative solutes and interpret how differences in slope, variability, and distribution reflect underlying biogeochemical and hydrologic processes.
Activity
From http://
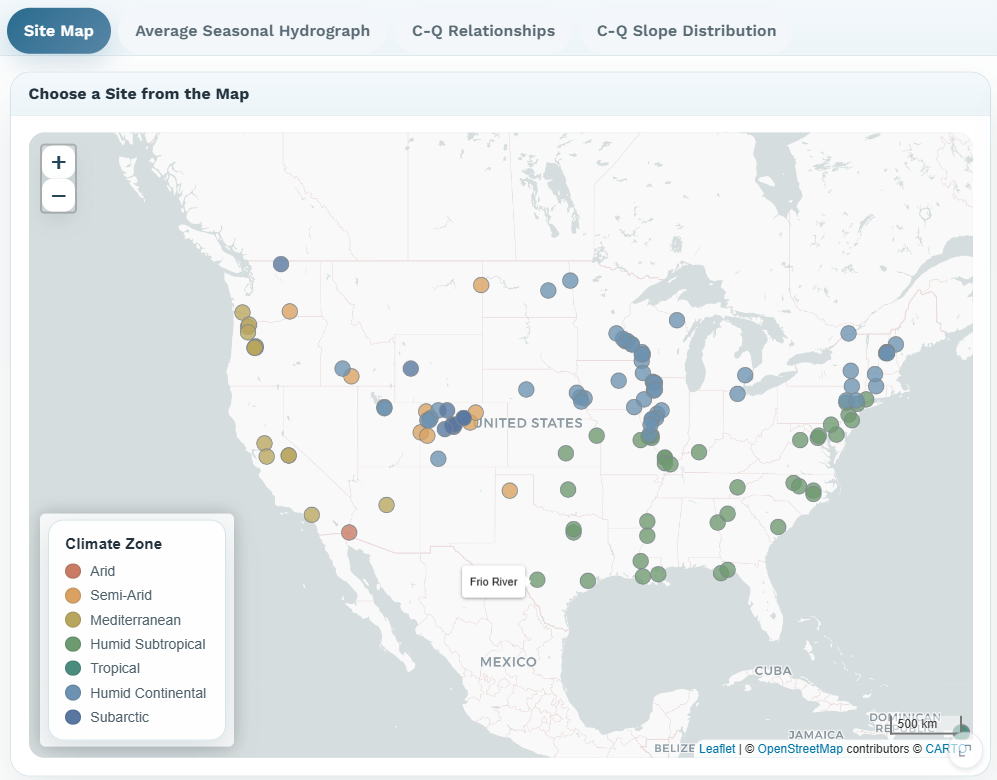
Figure 2: Snapshot of the Site Map tab (Activity 3) from the HydroViz interface.
Questions
The Site Map tab displays sites across North America, colored by Climate Zone. You can change the color of the points to reflect a different watershed characteristic by selecting an option from the drop down menu in the Controls panel. Begin by selecting a site from the Site Map at which you are interested in exploring hydrologic and water quality trends. Navigate to the Average Seasonal Hydrograph tab. Your selected site from the Site Map will autopopulate into the Average Seasonal Hydrograph tab. The plot displays the monthly discharge for your selected site. Overlay Cl concentrations on top of the hydrograph by selecting “Chloride (Cl)” from the Controls panel to the left of the plot. Describe the relationship between seasonal Cl and seasonal discharge. Do the timings of minimum and maximum values of Cl and Q align or are they misaligned?
Now add NO3 concentrations to the plot by selecting “Nitrate (NO3)” from the Controls panel. Describe the seasonal relationship between NO3 and seasonal discharge. Do the timings of minimum and maximum values of NO3 and Q align or are they misaligned? Note, if the concentrations of the Cl and NO3 are very different you can either deselect “Chloride (Cl)” to rescale the axis or select “Normalize Chemistry” in the Controls panel to z-score normalize the Cl and NO3 concentrations and evaluate their seasonality together.
Are the seasonal patterns of Cl and NO3 similar? Which solute, Cl or NO3, exhibits a more similar shape to discharge? Based on the seasonal patterns of discharge and chemistry, predict whether Cl and NO3 will exhibit diluting, chemostatic, or mobilizing C-Q behavior. Explain your reasoning. Note, if the concentrations of the Cl and NO3 are very different you can either deselect “Chloride (Cl)” to rescale the axis or select “Normalize Chemistry” in the Controls panel to z-score normalize the Cl and NO3 concentrations and evaluate their seasonality together.
Navigate to the C-Q Relationships tab and select “Chloride (Cl)” in the Controls panel. Your site selection from the Site Map will continue to autopopulate into the C-Q Relationships tab. Describe the C-Q relationship for Cl. Scroll down to below the plot to the table which reports the regression model, slope, and R2. Record the slope and R2. What does the R2 value suggest about the strength of the relationship between chloride and discharge? Which C-Q category (e.g., diluting, chemostatic, or mobilizing) does it fall into? Explain why this slope falls into the diluting, chemostatic, or mobilizing category. Were your predictions about Cl C-Q supported by the observed C-Q relationships? If not, what aspects of the hydrograph or seasonal chemistry may have led to an incorrect prediction?
Now add NO3 to the plot by selecting “Nitrate (NO3)” from the Controls panel. Record the slope, R2, and C-Q category. Explain why this slope falls into the diluting, chemostatic, or mobilizing category. Were your predictions about NO3 C-Q supported by the observed C-Q relationships? If not, what aspects of the hydrograph or seasonal chemistry may have led to an incorrect prediction?
Do Cl and NO3 exhibit the same CQ behavior? Discuss both the C-Q category, the steepness of the slope, and the strength (R2) of the C-Q relationship.
Describe the C-Q slopes of Cl and NO3 for two other watersheds by navigating back to the Site Map tab, selecting a site, and then returning to the C-Q Relationships tab. Your site selection from the Site Map will autopopulate into the C-Q Relationships tab. Select two additional watersheds that differ in climate and/or land use from your original site. You will have to do one site at a time. For each site, record the slope, R2, C-Q category, and note whether or not Cl and NO3 exhibit similar or different C-Q behavior.
Navigate to the C-Q Slope Distribution tab. This tab shows a histogram of C-Q slopes for both NO3 and Cl across all the sites in North America. Compare the distributions of Cl and NO3 C-Q slopes. Which solute exhibits greater variability in C-Q behavior across watersheds? What does this suggest about the relative importance of hydrologic transport (e.g., conservative) versus biological and chemical processing for these two solutes (e.g., reactive)? Does the distribution of C-Q slopes align with Cl behaving conservatively and NO3 behaving reactively? Explain your reasoning.
Return to the three sites you examined in detail above. Based on the information you gained about Cl and NO3 from the C-Q Slope Distribution tab, does the behavior of Cl and NO3 at your three selected sites support the idea that Cl acts as a more conservative tracer than NO3? Consider the C-Q slope, variability, and strength of the relationship across the three watersheds in your answer. If your site(s) deviate from the expected C-Q behavior based on question 8, put forth some hypotheses about why they might deviate.